
Introduction
In today’s competitive market, businesses must stay ahead by making informed decisions. Advanced data visualization techniques from QISPL enable businesses to gain a deeper understanding of their data, driving performance and growth.
Benefits of Advanced Data Visualization
- Actionable Insights: Convert raw data into actionable insights that can be immediately applied to business strategies.
- Predictive Analytics: Use data visualization to support predictive analytics and forecast future trends.
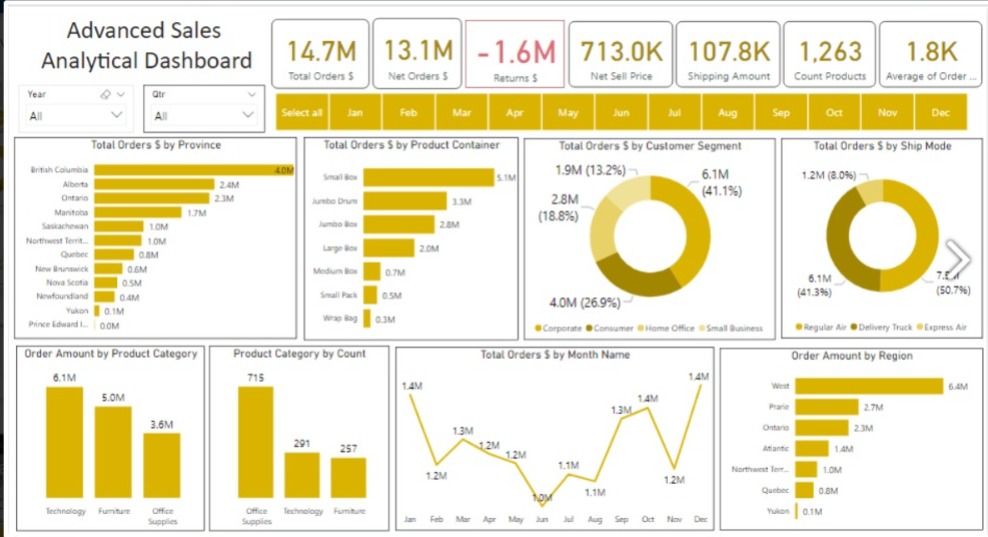
- Real-Time Monitoring: Visual tools like Power BI allow for real-time monitoring of key performance indicators (KPIs).
Our Services
- Tableau: Create sophisticated visualizations that make complex datasets more accessible.
- Apache Spark: Manage and visualize big data for scalable, real-time insights.
- Looker: Simplify data exploration with user-friendly, powerful dashboards.
Key Industries We Serve
- Manufacturing: Track production processes and optimize supply chains with detailed visual reports.
- Finance: Use visual tools to monitor market trends and make investment decisions.
- Healthcare: Improve patient care by visualizing and analyzing health data.
Why QISPL?
- Innovative Solutions: We stay at the forefront of data visualization technology to deliver cutting-edge solutions.
- Cost-Effective: Get the most value from your data with our affordable data visualization services.
- Customer Satisfaction: Our client-centric approach ensures that our solutions meet your specific business goals.
Contact Us:
- Address: FME – 01, Swami Regency, Canal Rd, near Panchshil Talkies, Ramdaspeth, Nagpur, Maharashtra 440010, India
- Phone: +91 99605 86464
- Email: info@qispl.com
- Website: www.qispl.com